Factors Affecting the Rate of Photosynthesis
GCSE: Biology · Combined Science
Big enquiry: How do carbon dioxide and temperature affect the rate of photosynthesis?
On the previous page, Maya used pondweed to investigate how light intensity affects the rate of photosynthesis.
She measured the oxygen produced in one minute.
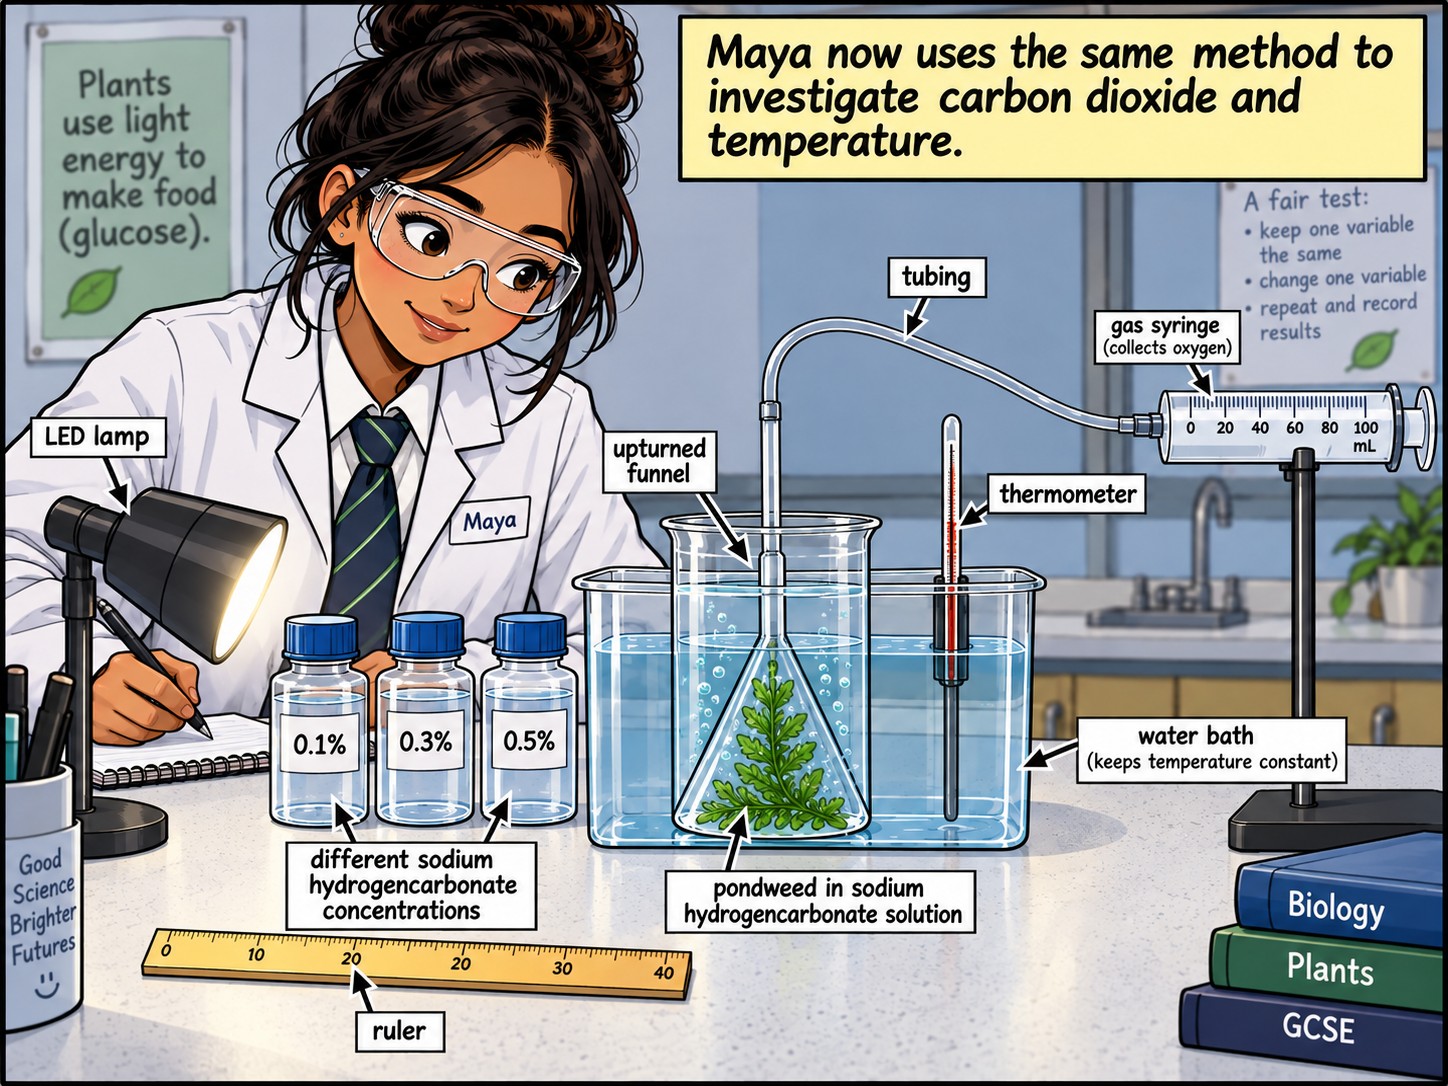
Now she uses the same method to investigate carbon dioxide and temperature.
Then she compares the factors that can affect the rate and uses the idea of a limiting factor.
Investigating another factor: carbon dioxide
1 of 2
Maya already knows the investigation pattern from the previous page.
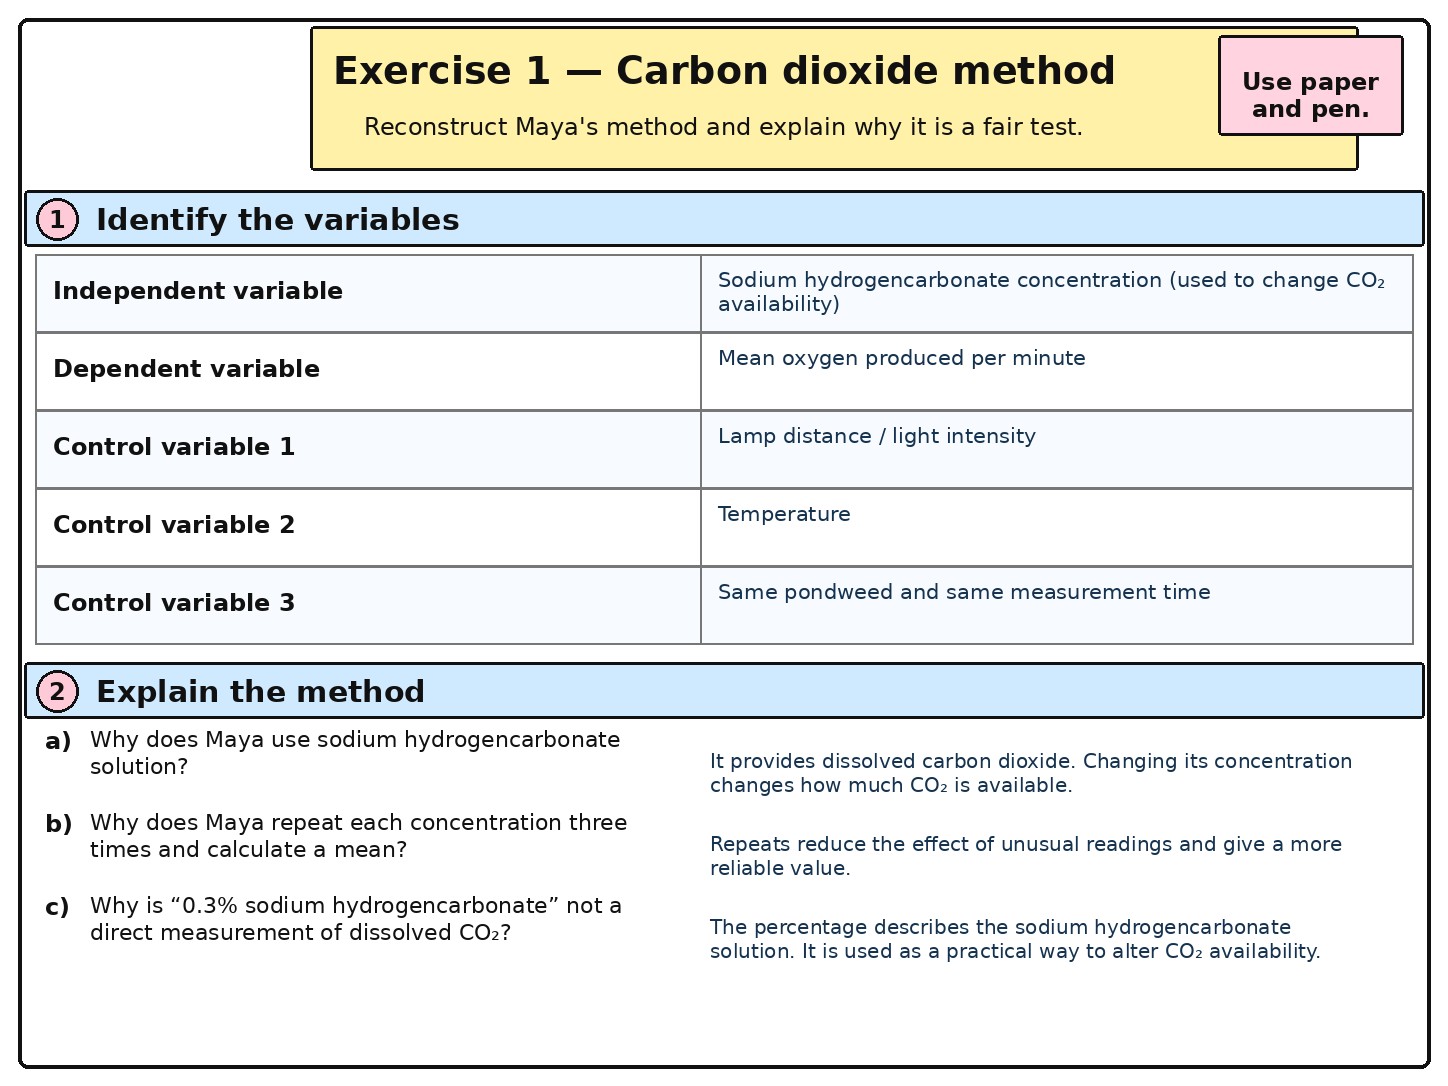
She changes one condition, keeps the others as constant as possible, measures the oxygen produced in one minute, repeats the measurement three times and calculates a mean.
Now she investigates carbon dioxide availability.
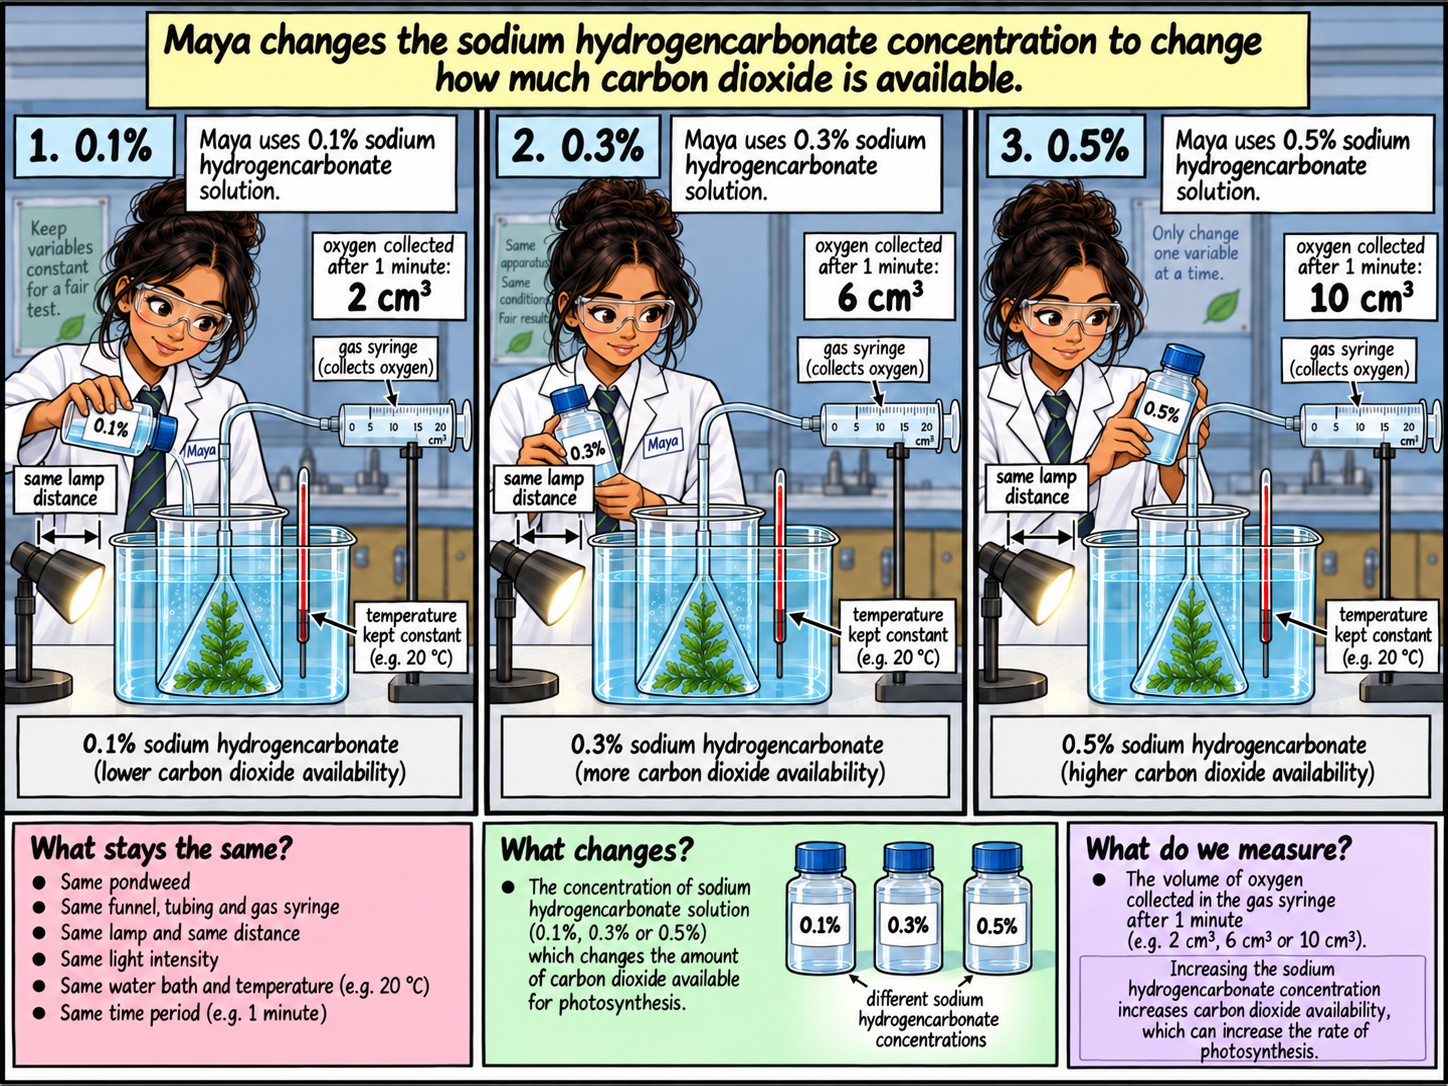
The pondweed is underwater, so Maya changes the amount of carbon dioxide available in the water by changing the concentration of sodium hydrogencarbonate solution.
A higher sodium hydrogencarbonate concentration usually makes more carbon dioxide available to the pondweed.
The percentage of sodium hydrogencarbonate is a practical way to change carbon dioxide availability. It is not a direct measurement of the dissolved carbon dioxide concentration.
Maya tests 0.1%, 0.2%, 0.3%, 0.4%, 0.5% and 0.6% sodium hydrogencarbonate solution.
For every concentration she uses the same volume of solution and the same pondweed.
She keeps the lamp at the same distance and keeps the temperature steady with the water bath.
She gives the pondweed time to adjust before she starts each measurement.
At each concentration Maya measures the oxygen produced in one minute three times and calculates the mean.
Her results are:
| Sodium hydrogencarbonate concentration | Reading 1 (cm³) | Reading 2 (cm³) | Reading 3 (cm³) | Mean oxygen (cm³/min) |
|---|---|---|---|---|
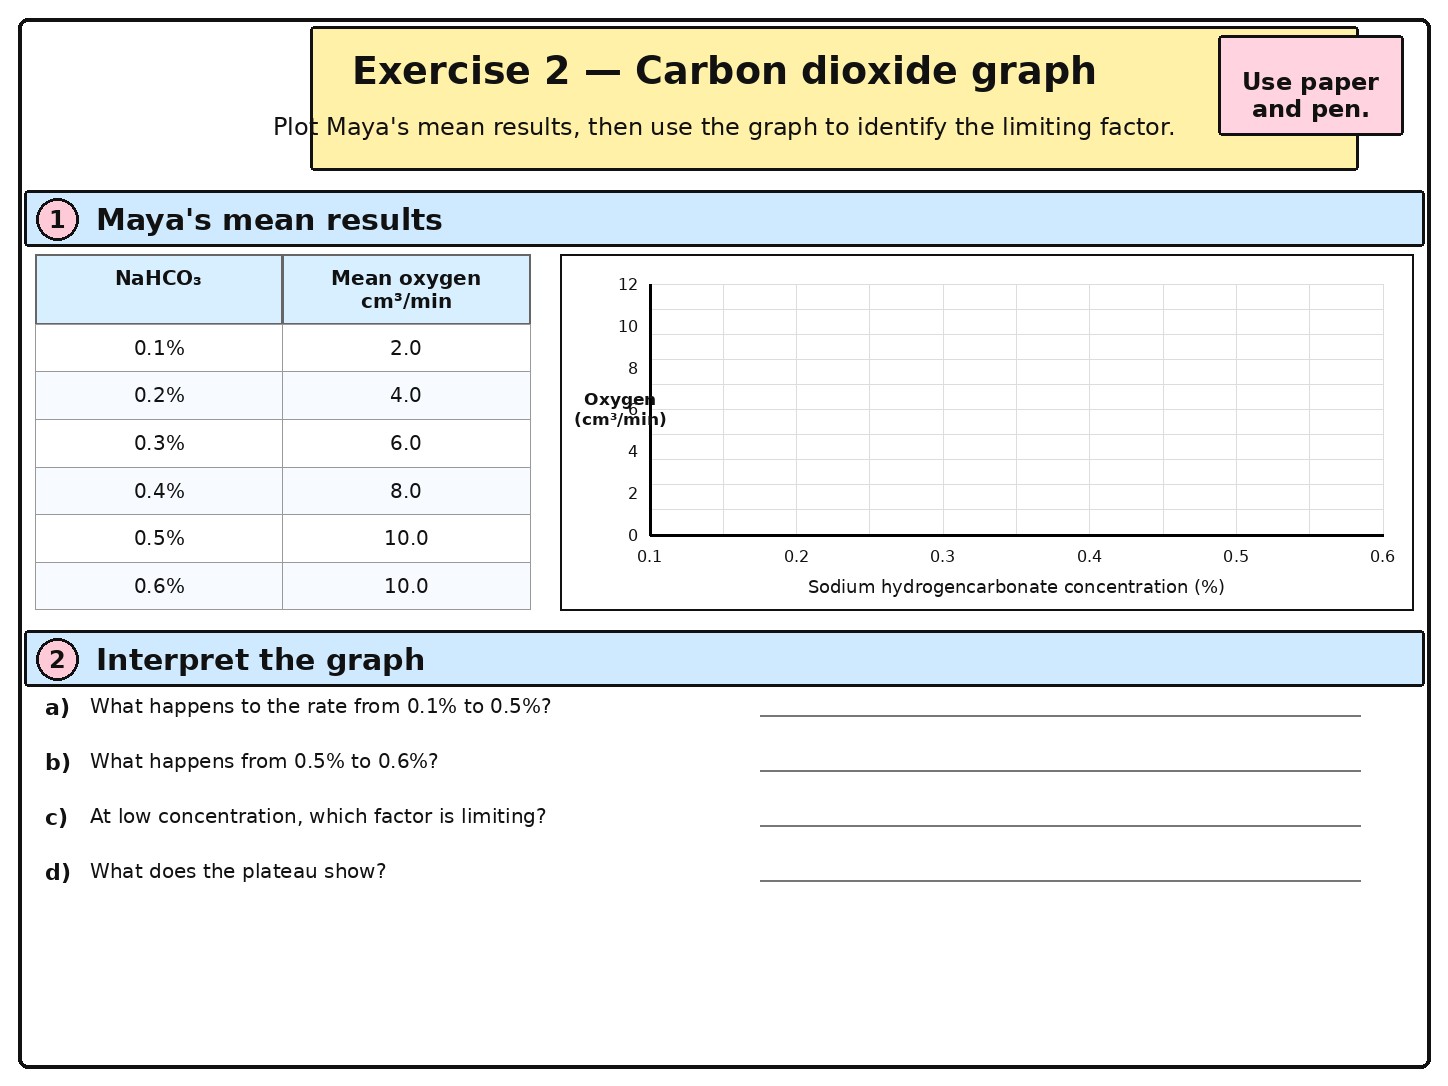
| 0.1% | 2.0 | 2.1 | 1.9 | 2.0 |
| 0.2% | 4.0 | 4.1 | 3.9 | 4.0 |
| 0.3% | 6.0 | 6.2 | 5.8 | 6.0 |
| 0.4% | 8.0 | 8.2 | 7.8 | 8.0 |
| 0.5% | 10.0 | 10.2 | 9.8 | 10.0 |
| 0.6% | 10.0 | 10.1 | 9.9 | 10.0 |
Maya plots sodium hydrogencarbonate concentration against mean oxygen produced per minute.
The graph comes from these same results.
What does the carbon dioxide investigation show?
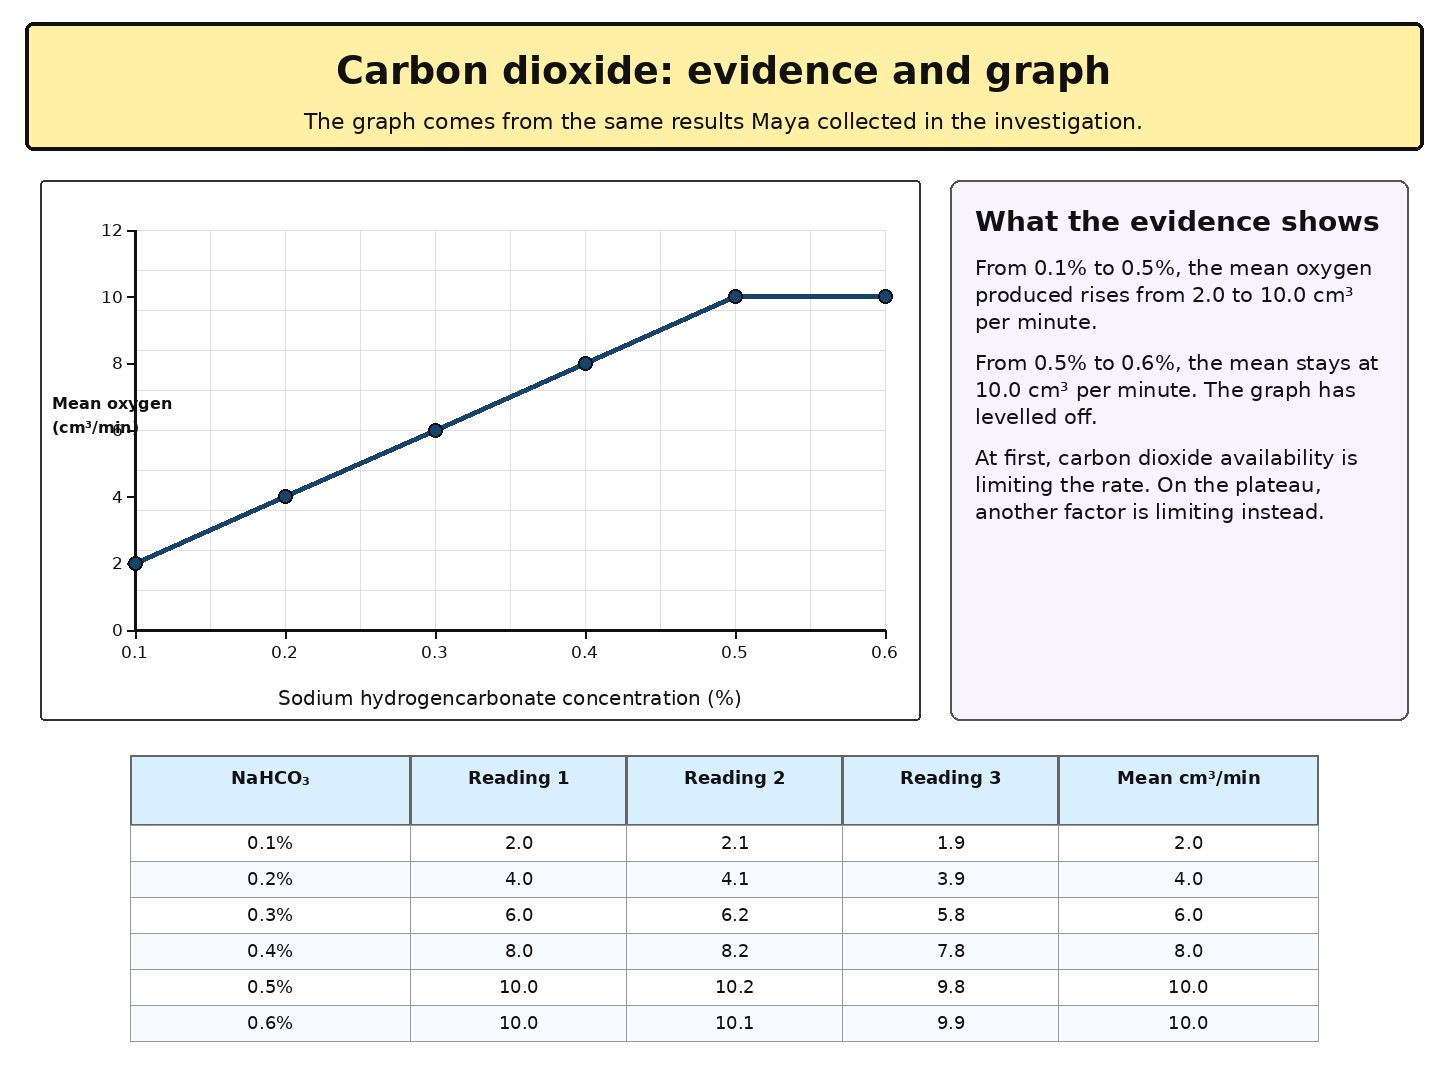
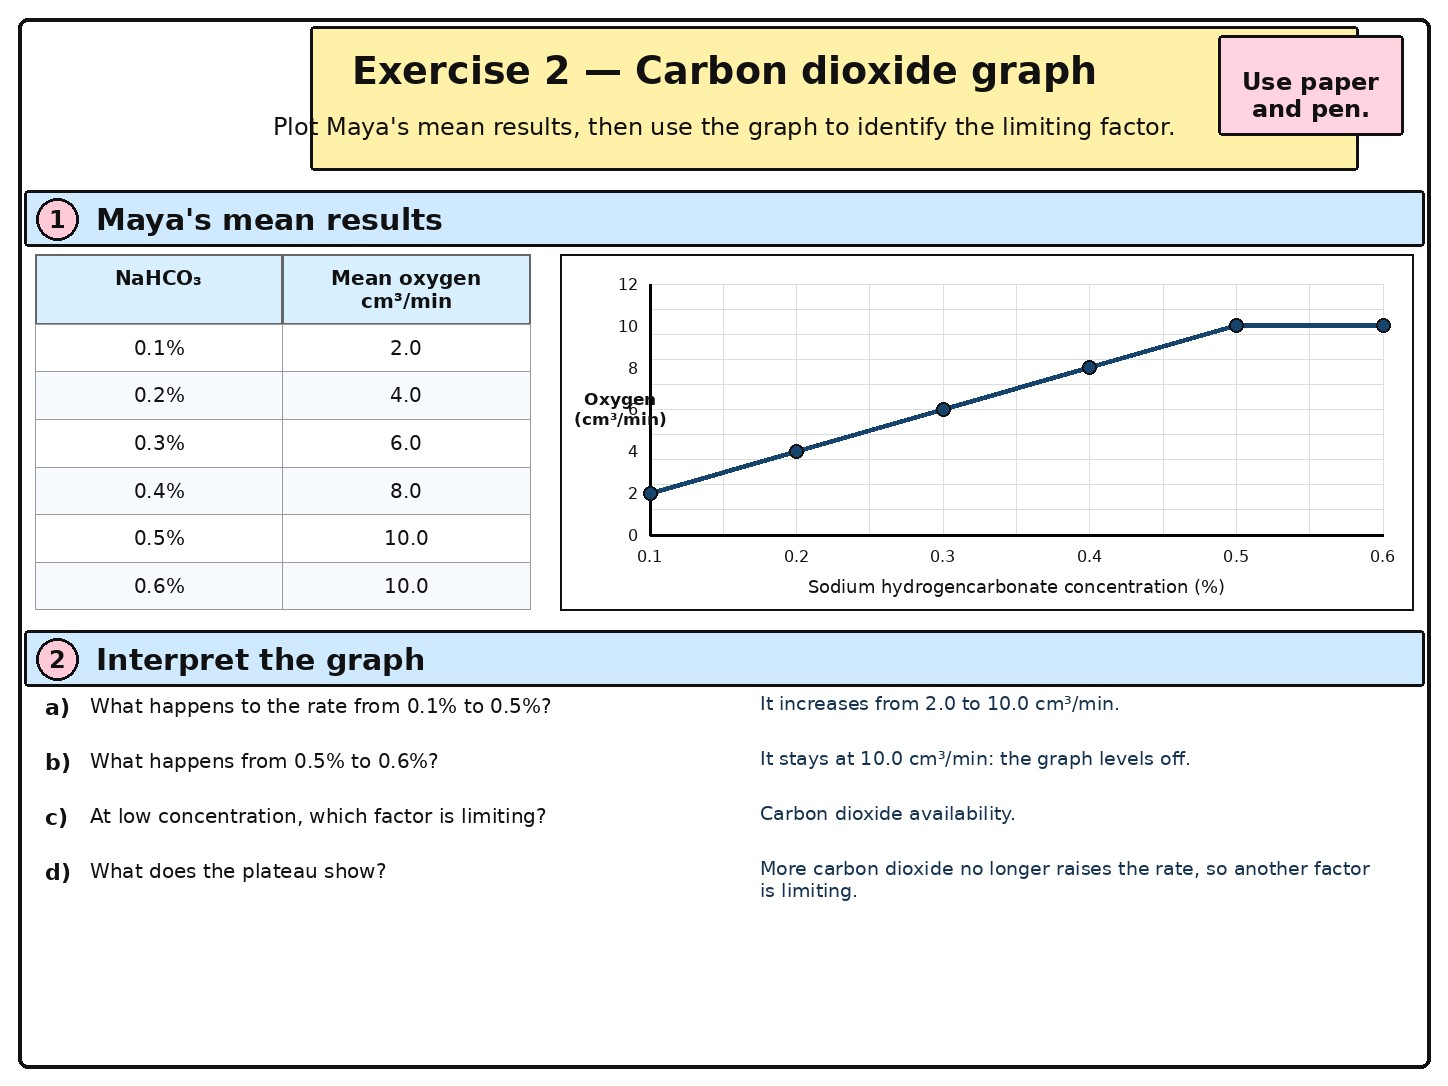
From 0.1% to 0.5% sodium hydrogencarbonate, the mean oxygen produced rises from 2.0 to 10.0 cm³ per minute.
More carbon dioxide is available and the rate of photosynthesis increases.
At these lower concentrations, carbon dioxide is limiting the rate.
From 0.5% to 0.6%, the mean stays at 10.0 cm³ per minute.
The graph has levelled off.
Adding more sodium hydrogencarbonate no longer increases the measured rate.
Carbon dioxide is therefore no longer the limiting factor.
Another factor is now preventing the rate from increasing further.
This graph does not tell Maya which factor that is. It could be light, temperature or another condition.
Investigating temperature
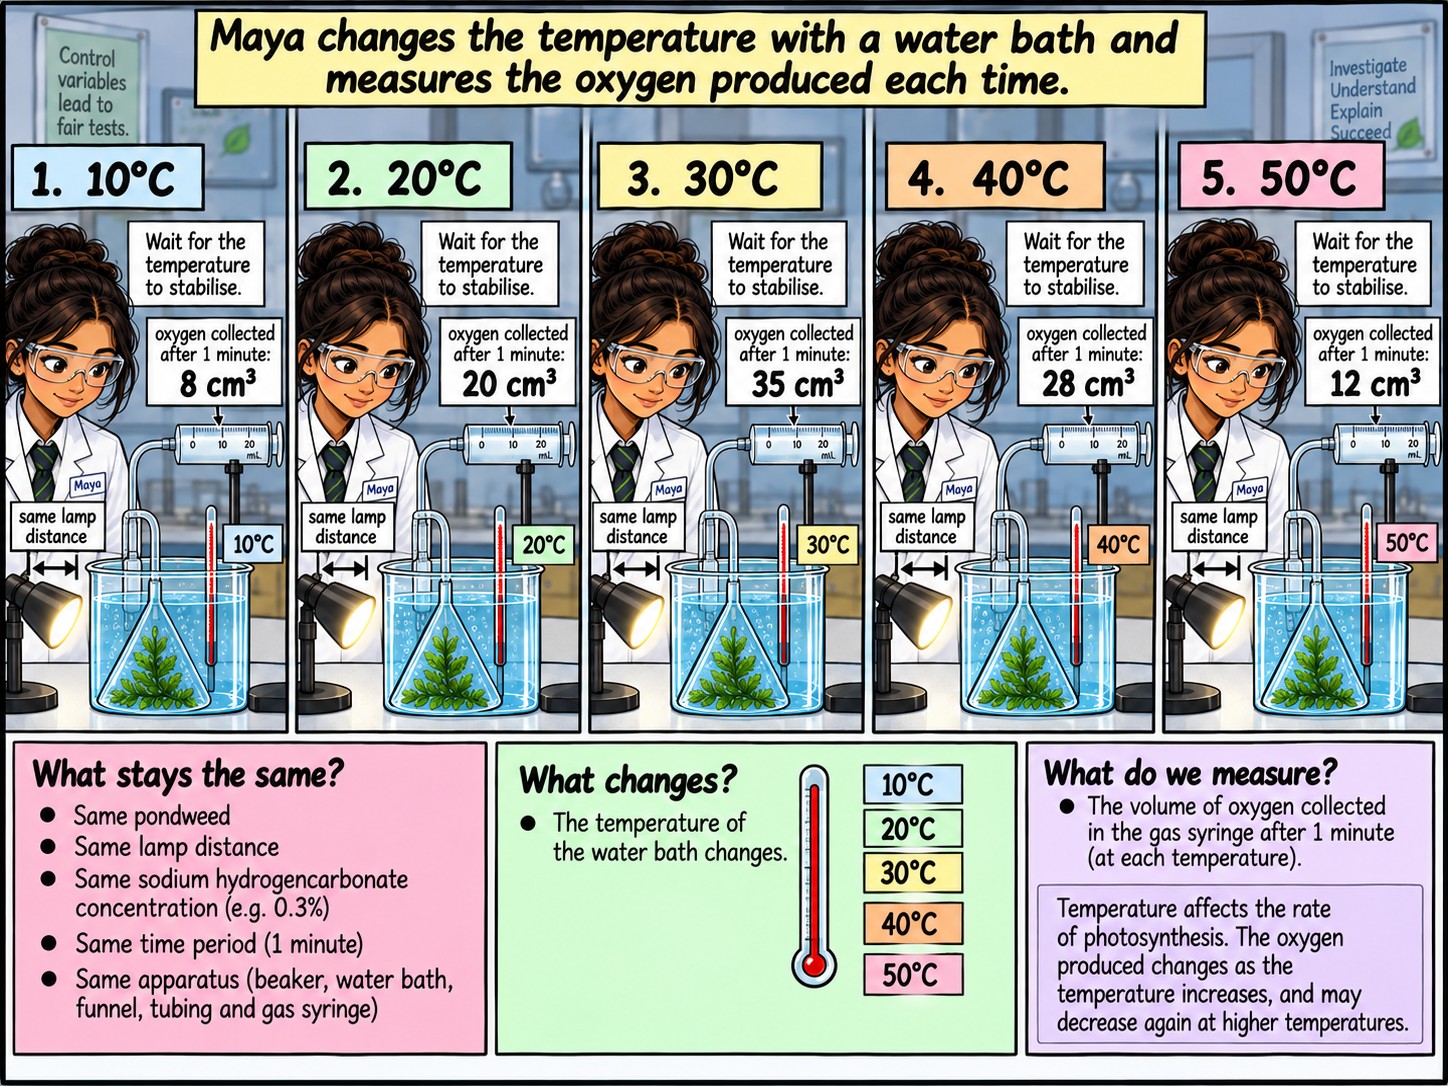
Maya now investigates temperature.
She uses the same pondweed, funnel and gas syringe.
The beaker containing the pondweed sits inside a larger container of water. This is the water bath.
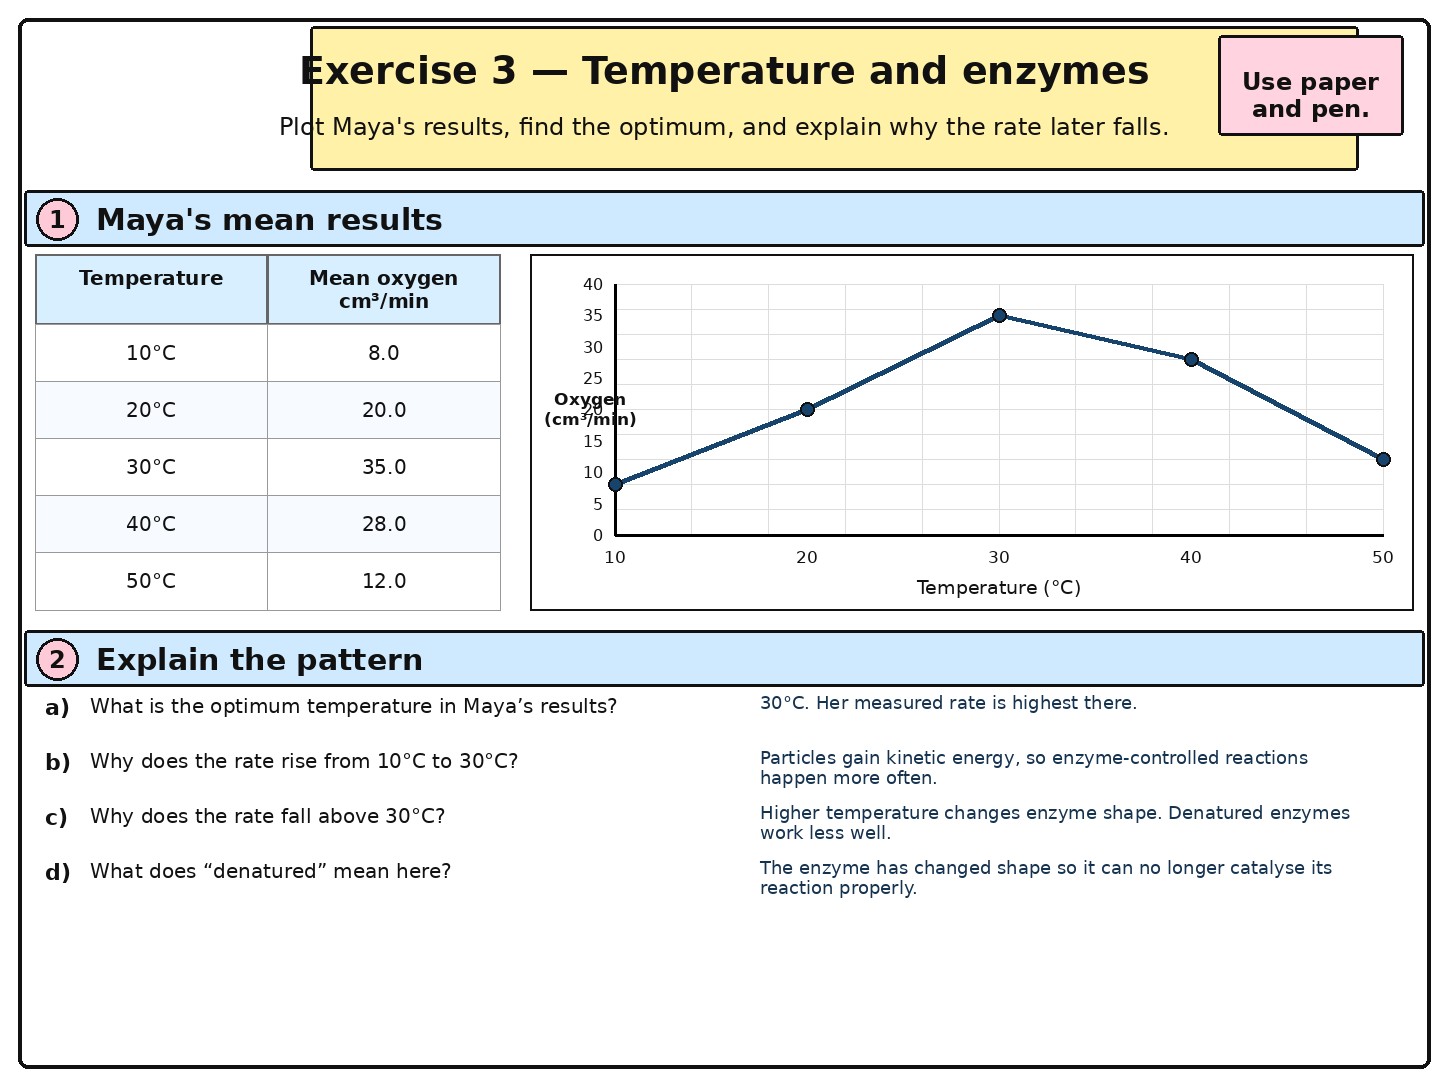
Maya tests 10°C, 20°C, 30°C, 40°C and 50°C.
She checks the temperature of the solution around the pondweed with a thermometer.
After changing the water bath, she waits until the solution around the pondweed has reached the temperature she wants to test.
Throughout the investigation, Maya keeps the lamp at the same distance and uses the same concentration of sodium hydrogencarbonate solution.
Only temperature is deliberately changed.
At each temperature Maya measures the oxygen produced in one minute three times and calculates the mean.
Her results are:
| Temperature | Reading 1 (cm³) | Reading 2 (cm³) | Reading 3 (cm³) | Mean oxygen (cm³/min) |
|---|---|---|---|---|
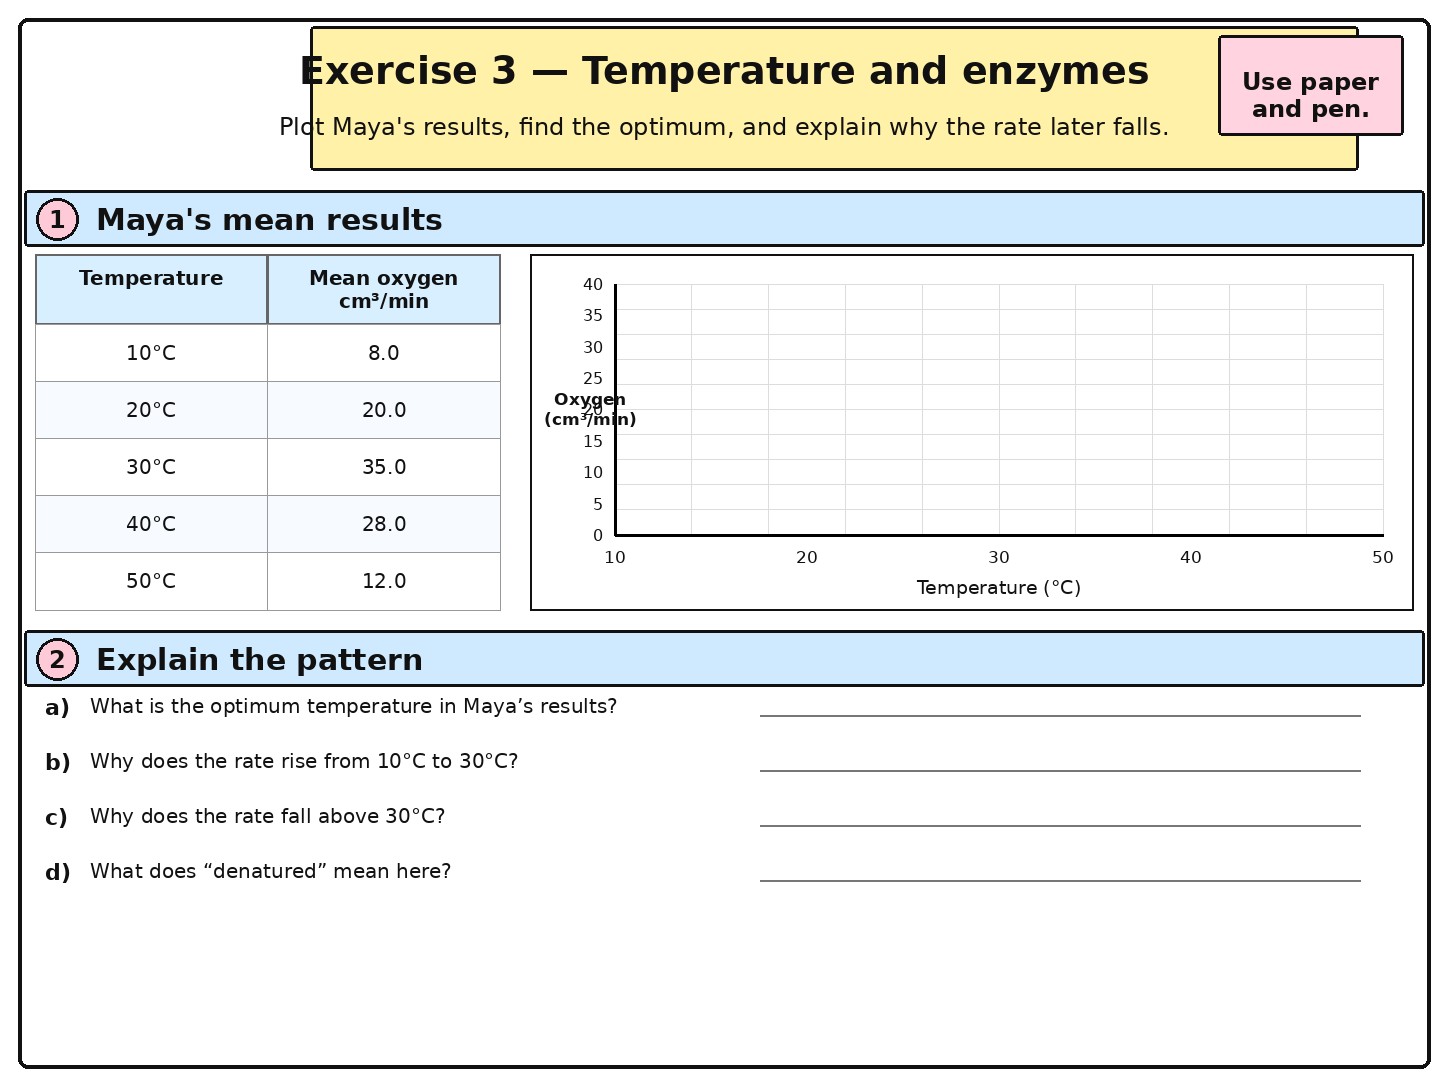
| 10°C | 8.0 | 8.2 | 7.8 | 8.0 |
| 20°C | 20.0 | 20.4 | 19.6 | 20.0 |
| 30°C | 35.0 | 35.4 | 34.6 | 35.0 |
| 40°C | 28.0 | 28.3 | 27.7 | 28.0 |
| 50°C | 12.0 | 12.2 | 11.8 | 12.0 |
Maya plots temperature against mean oxygen produced per minute.
Again, the graph comes from the same results shown in the table.
What does the temperature graph show?
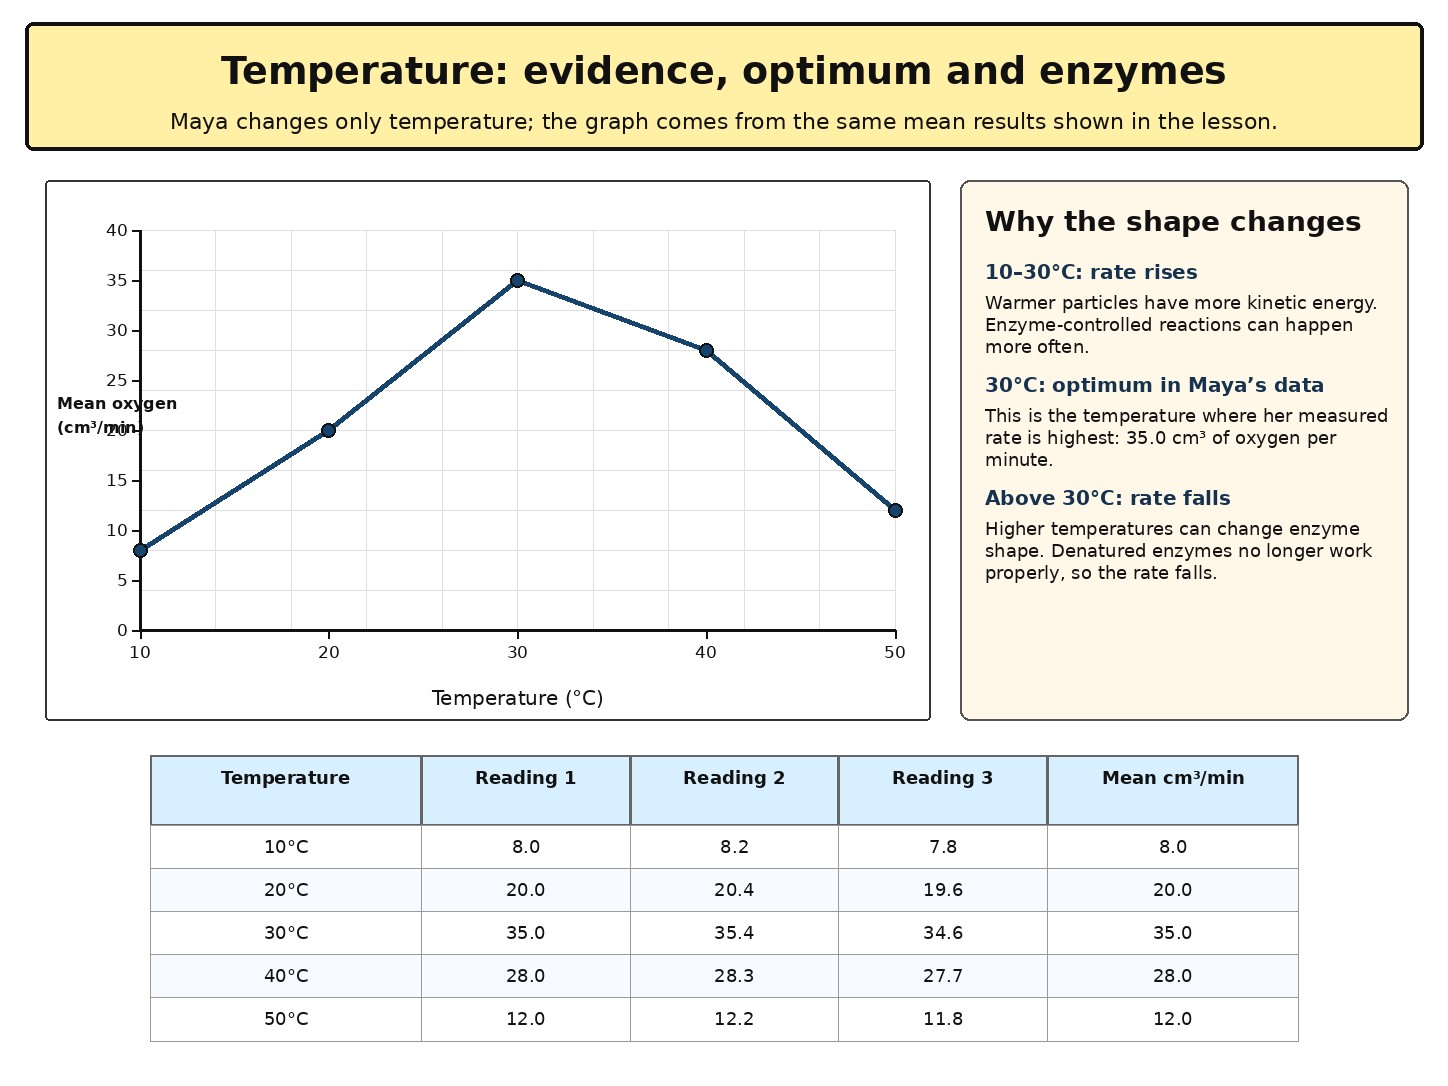
Maya's temperature graph rises and then falls.
At 10°C the rate is relatively low.
The rate increases through 20°C and is highest at 30°C in Maya's results.
The optimum temperature is the temperature at which the measured rate is highest.
For Maya's results, the optimum is 30°C.
Photosynthesis involves a series of chemical reactions. Some are controlled by enzymes.
An enzyme is a protein that helps a particular chemical reaction happen.
At lower temperatures, particles have less kinetic energy and successful collisions happen less often. The enzyme-controlled reactions happen more slowly.
As temperature rises, particles have more kinetic energy and successful collisions happen more often, so the rate increases.
Above the optimum, the rate falls.
High temperatures can change the shape of an enzyme, including the shape of its active site. The enzyme is denatured and no longer works properly.
That is why Maya's measured rate falls at 40°C and falls further at 50°C.
Bringing the three investigations together
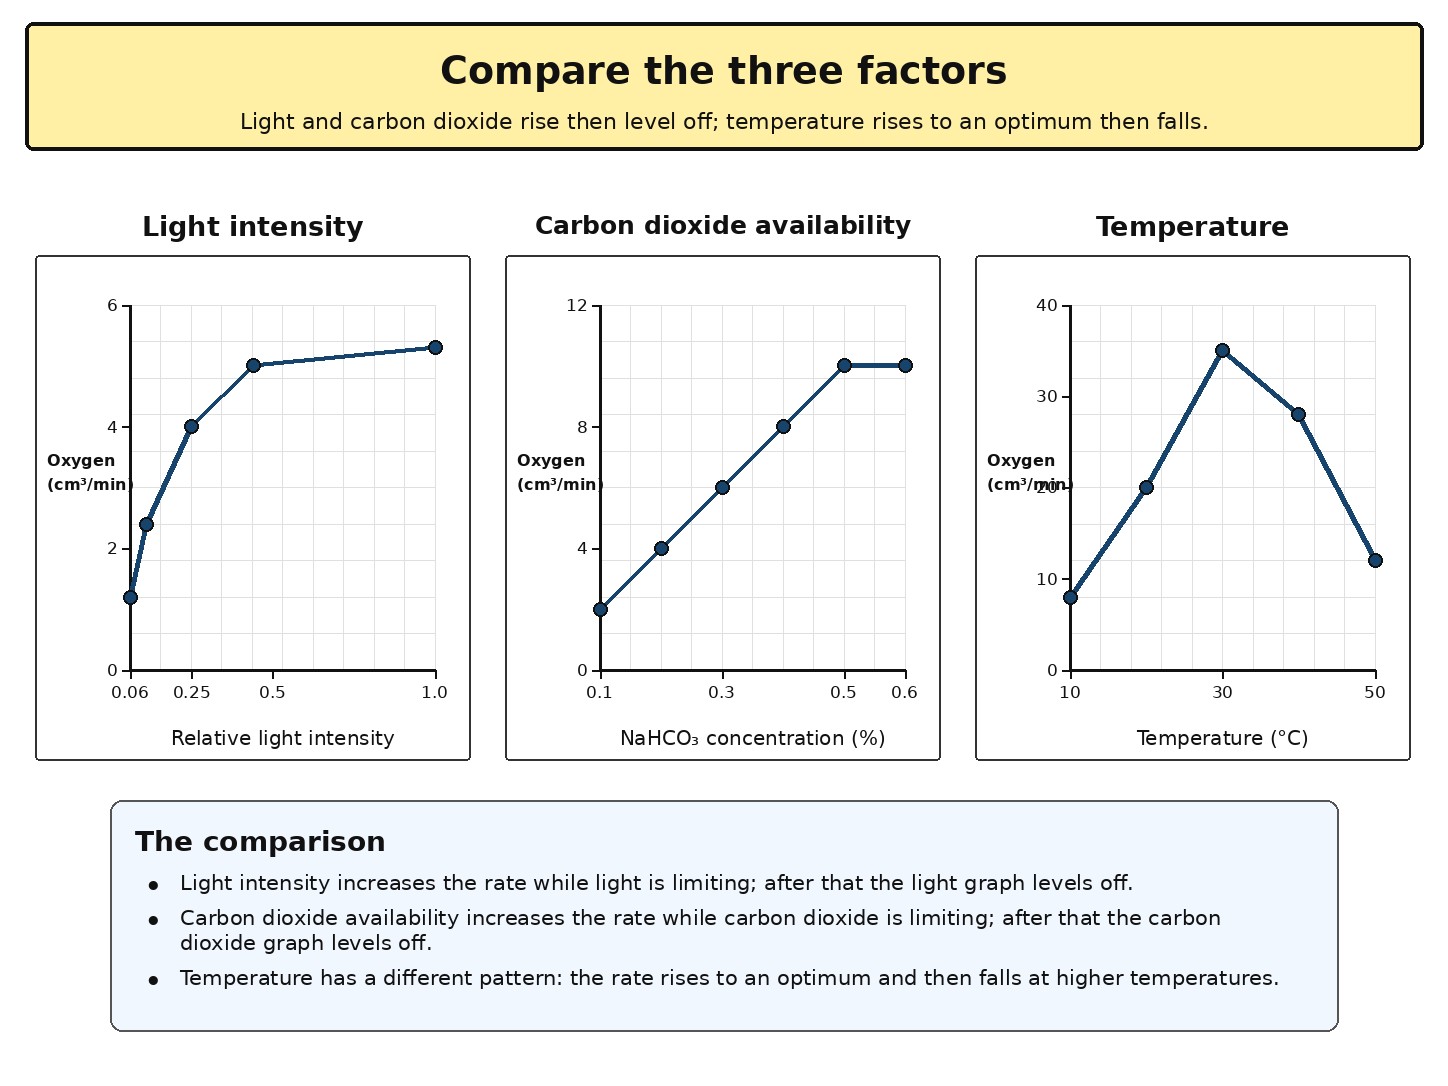
Maya has directly investigated three conditions.
She changed light intensity by changing the distance of the lamp.
She changed carbon dioxide availability by changing the concentration of sodium hydrogencarbonate solution.
She changed temperature using a water bath.
In every investigation she measured the same response: the volume of oxygen produced in one minute.
This lets her compare the rate of photosynthesis under different conditions.
The graph patterns are different.
For light intensity, the rate rises and then levels off when another factor becomes limiting.
For carbon dioxide availability, the rate also rises and then levels off.
For temperature, the rate rises to an optimum and then falls because high temperature can denature enzymes.
The amount of chlorophyll can also affect the rate of photosynthesis because chlorophyll absorbs light energy.
A leaf with less chlorophyll may absorb less light, so its rate may be lower.
Maya did not vary chlorophyll in these pondweed investigations, so these three datasets do not measure that effect.
The limiting factor can change
A limiting factor is the condition that is preventing the rate of photosynthesis from increasing further.
The limiting factor depends on the conditions.
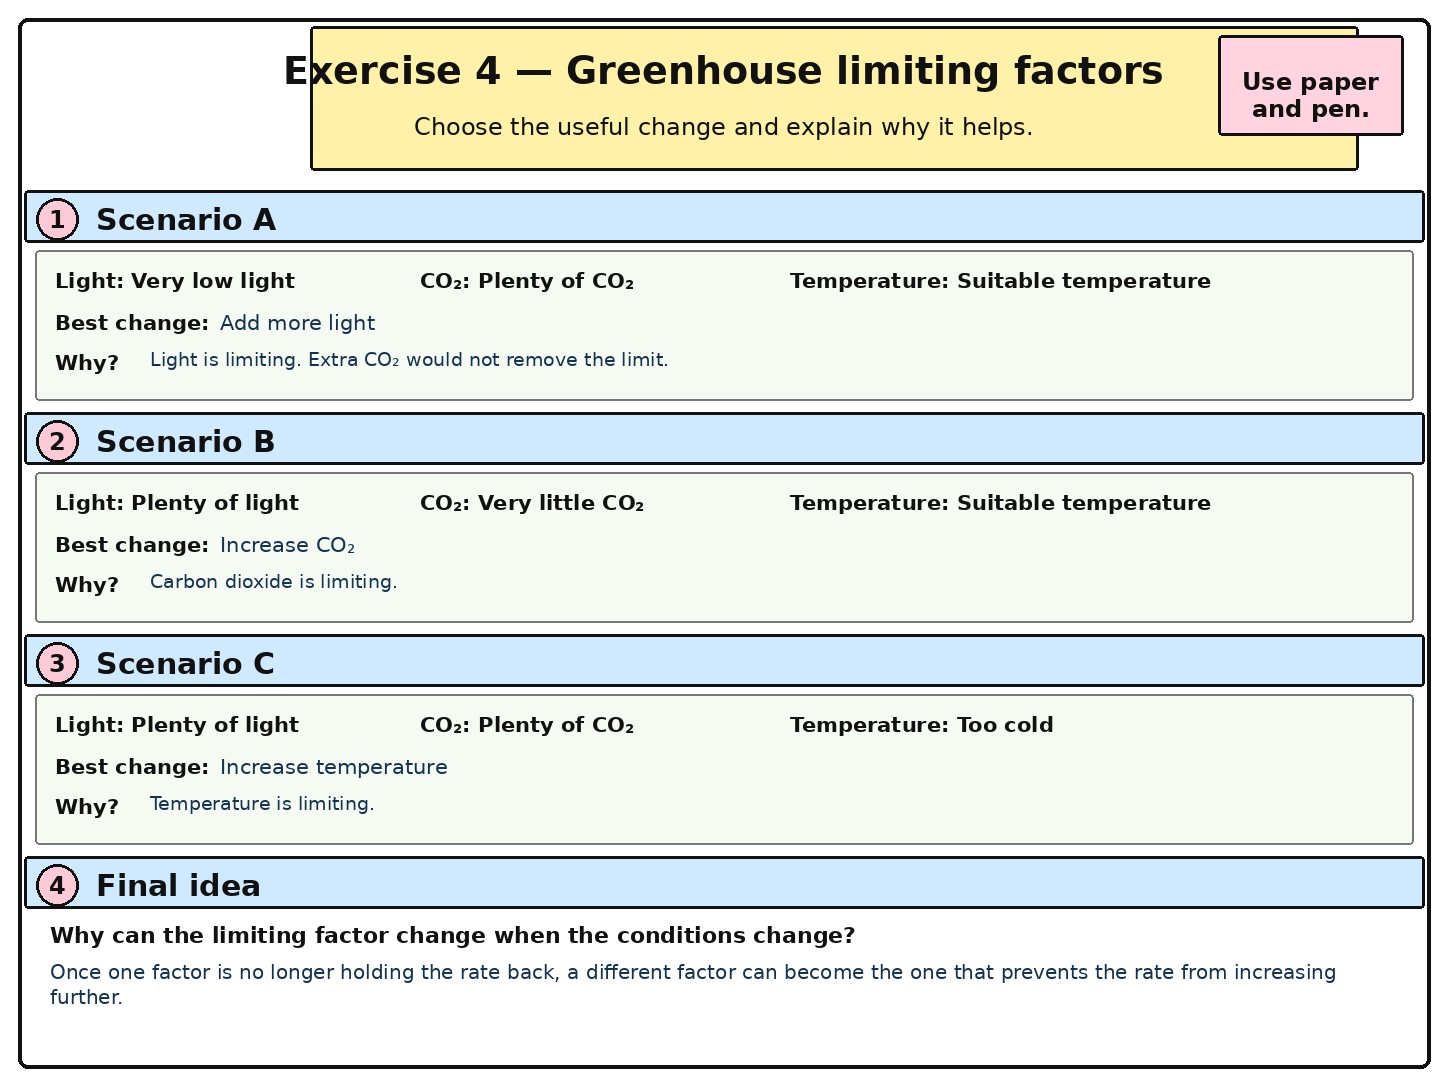
Imagine the pondweed has plenty of carbon dioxide and is at a suitable temperature, but receives very little light.
The rate remains low because light is limiting.
Giving it even more carbon dioxide is unlikely to help much.
If Maya increases the light intensity, the rate can rise.
Once there is plenty of light, another factor may become limiting.
If carbon dioxide is now in short supply, increasing carbon dioxide can raise the rate again.
If the temperature is too low, temperature may be limiting instead.
There is no single factor that always limits photosynthesis.
Changing the conditions can change the limiting factor.
Why this matters in a greenhouse
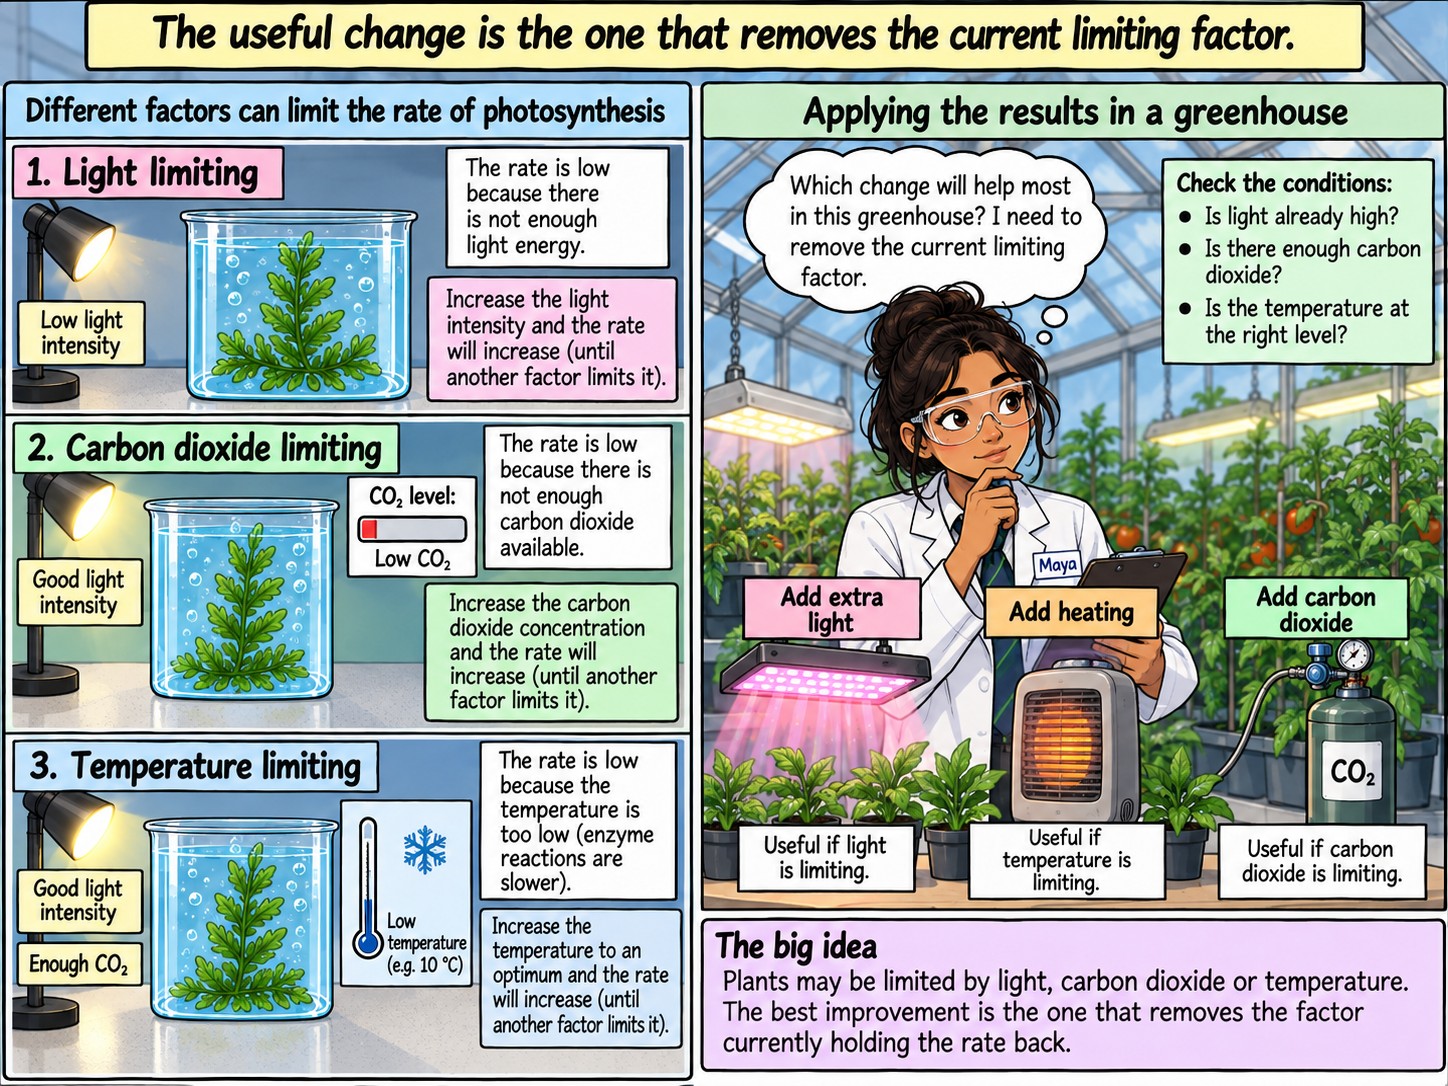
Greenhouse growers can change some of the conditions around their plants.
They can provide extra light, increase the temperature or increase the carbon dioxide concentration.
All of these changes cost money.
A useful change is one that removes the current limiting factor.
If light is already plentiful, paying for more lighting may produce little benefit.
If carbon dioxide is limiting the rate, increasing carbon dioxide may raise the rate.
If the greenhouse is too cold, heating may have the greater effect.
Growers therefore compare the likely increase in photosynthesis and crop yield with the cost of changing the conditions.
The best choice depends on which factor is limiting at that time.
Remember this lesson
These exercises are for learners following Maya's investigations, whether or not they can carry out the practical work themselves.
Use paper and pen. Each exercise carousel starts on the learner version. Complete slide 1 before moving to slide 2 to check the completed answer. Correct anything you missed, then try the task again later without looking at the answer.
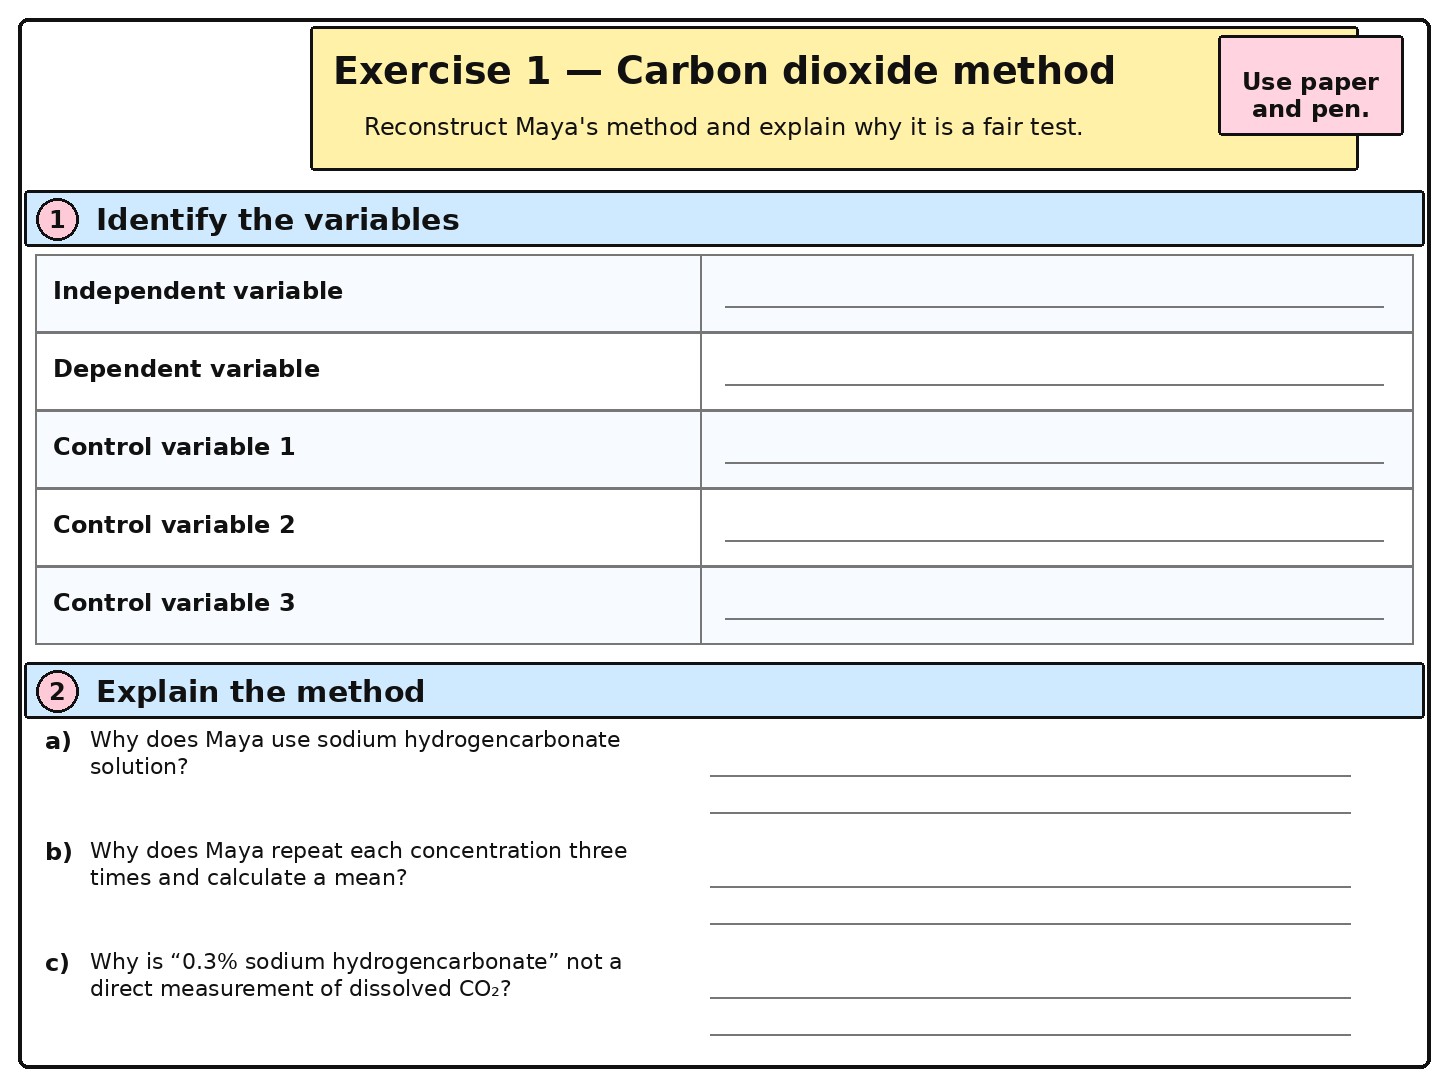
Exercise 1 — Carbon dioxide method
1 of 2
Slide 1 is the exercise. Reconstruct Maya's carbon dioxide investigation: identify the independent variable, dependent variable and three control variables, then explain the use of sodium hydrogencarbonate, repeats and the mean. When you have finished, move to slide 2 to check the completed answer.
Exercise 2 — Carbon dioxide graph
1 of 2
Slide 1 is the exercise. Plot Maya's mean carbon dioxide results, then use the graph to explain the rise, the plateau and which factor is limiting at low concentration. When you have finished, move to slide 2 to compare your graph and explanations with the completed answer.
Exercise 3 — Temperature and enzymes
1 of 2
Slide 1 is the exercise. Plot Maya's temperature results, identify the optimum in her data, and explain why the rate rises and then falls using enzyme-controlled reactions and denaturation. When you have finished, move to slide 2 to check the completed answer.
Exercise 4 — Greenhouse limiting factors
1 of 2
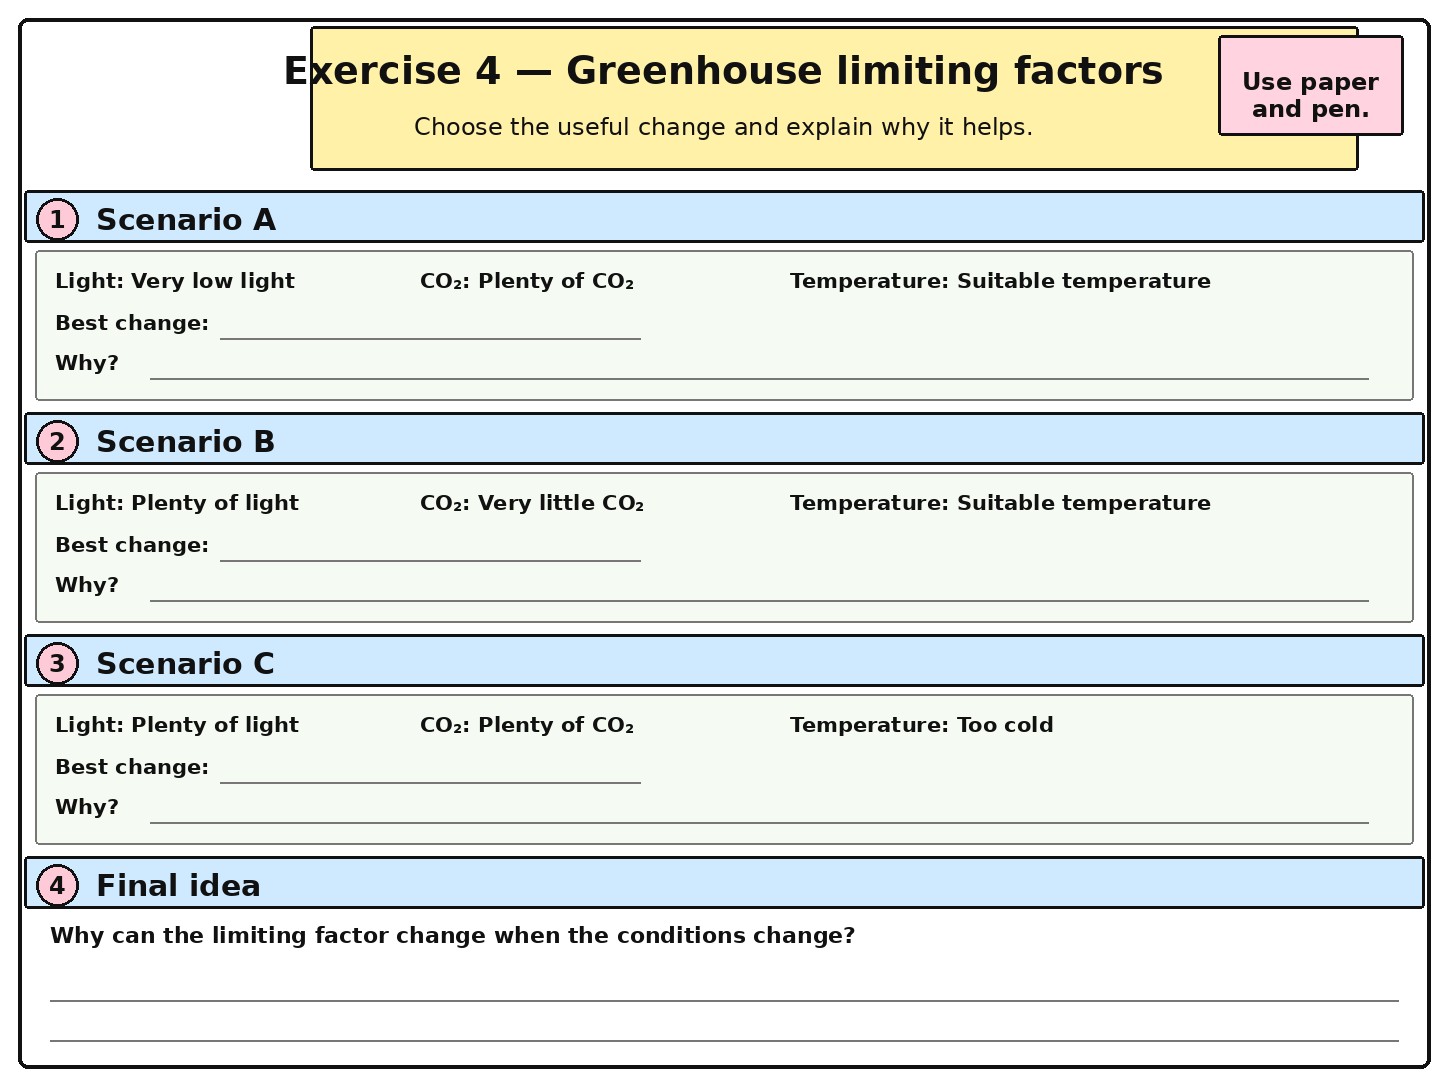
Slide 1 is the exercise. For each greenhouse scenario, identify the limiting factor, choose the useful change and explain why it should help. Then explain why the limiting factor can change when conditions change. Move to slide 2 only after you have completed the task.
GCSE knowledge coverage
By the end of this page, you should be able to:
- explain how carbon dioxide concentration and temperature affect the rate of photosynthesis;
- recall that light intensity, carbon dioxide concentration, temperature and amount of chlorophyll can affect the rate;
- describe a fair pondweed investigation in which one factor is changed and oxygen production is measured over a fixed time;
- explain why repeated readings and a mean make the evidence more reliable;
- interpret photosynthesis-rate graphs, including a plateau and a temperature optimum;
- explain the effect of temperature using kinetic energy, enzyme-controlled reactions and denaturation;
- explain what a limiting factor is and why the limiting factor can change;
- use limiting factors to explain decisions about lighting, heating and carbon dioxide in a greenhouse;
- plot supplied data and use the graph as evidence for a conclusion.